This is a follow-up post where I elaborate on how to easily detect a broken to identify invalid HTML.
Are you struggling with web performance issues but can't pinpoint the cause? It might be hiding in plain sight within your HTML, particularly in the <head> section. I recently shared a clever yet straightforward technique to detect invalid HTML that could be sabotaging your site's performance. Let's dive into this method and how you can use it to enhance your site's efficiency.
The Problem: invisible HTML errors impacting performance
Invalid HTML, especially in the <head> section, is a common yet often overlooked problem. These errors can significantly affect your website's loading speed and overall performance. But how do you spot these elusive issues? The solution lies in disabling JavaScript to see your site's raw HTML structure.
Step-by-Step guide to detect invalid HTML
Step 1: Access Developer Tools
First, open your web browser's Developer Tools. You can do this by pressing CTRL + Shift + P (or Command + Shift + P on Mac).
Step 2: Disable JavaScript
In the Developer Tools, start typing "Disable." From the options that appear, select "Disable JavaScript."

Step 3: Open the Elements Panel
Once JavaScript is disabled, navigate to the "Elements" panel within the Developer Tools. This is where you'll inspect the HTML structure of your page.
Step 4: Refresh the page
Now, refresh your web page. This action will load the page without any JavaScript interference, revealing the exact HTML structure as processed by the browser.
Step 5: Analyze the HTML structure
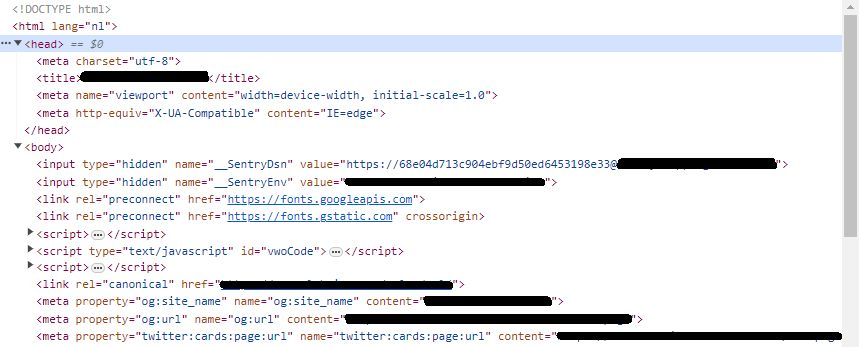
After refreshing, pay attention to the structure of the HTML elements. In some cases, you might notice that elements that you (or your platform) placed in the <head>, are now ending up in the <body>.
For instance, an <input> element that you or your platform placed in the <head> might be the first element in the <body>. This is illustrated in the image below:
You now know that this is the first breaking element in the <head> that should not have been there.
Why these steps work
Browsers automatically close the section when they encounter an element that is not allowed to be in the <head>. This process leads to subsequent elements being pushed into the <body> section as well though. It's a protective mechanism, but it can also mislead you about your site's actual HTML structure.
The impact on web performance
This kind of HTML mishap are likely to come with a negative impact on your site's performance. It can lead to slower load times and potentially harm your Core Web Vitals, a set of metrics crucial for a good user experience.
Why disabling JavaScript matters
Disabling JavaScript ensures that you see the raw HTML as interpreted by the browser. Other methods are not as effective:
- Looking directly at the HTML response gives you the raw HTML;
- Looking at the final HTML in the "Elements" panel will give you the HTML where other JS and third parties were embedded as well. They might have done all kinds of HTML manipulations once you get to the point of analyzing the HTML.
Disabling JavaScript before checking the "Elements" panel prevents any JavaScript-based manipulation or movement of DOM nodes and stops Google Tag Manager (GTM) from injecting scripts that could skew your analysis.
Conclusion
By following these five simple steps, you can unveil hidden HTML issues that might be hurting your website's performance. This method is a testament to the fact that sometimes, the most effective solutions are also the simplest. And no other tools needed besides the one you are using already.
Regularly conducting this check can help you maintain optimal site performance and ensure a seamless user experience.
I also wrote about this on LinkedIn.


