


I’ve spent years knee-deep in Lighthouse in my first few pagespeed years. I always assumed that one part was intentional design decision, but after 5 years I learned I was wrong.
Although I rely on tools like WebPageTest and DevTools instead of Lighthouse for lab data testing, a specific Lighthouse TTFB discussion came to my attention. And I tried to share my experience and knowledge on this matter, only to learn I was wrong all along.
The Lighthouse TTFB issue
The reported issue is that even when the TTFB is very high, the Lighthouse report in for example tools like PageSpeed Insights will under report metrics like FCP and LCP.
For example, your TTFB could be 7 seconds but FCP and LCP could then still end up being below 2 seconds. Which is physically impossible as in reality a browser is only able to make FCP and LCP happen after it received the first bytes of HTML (=TTFB).
Here is a scenario to compare:
Without sleep i.e. no TTFB delay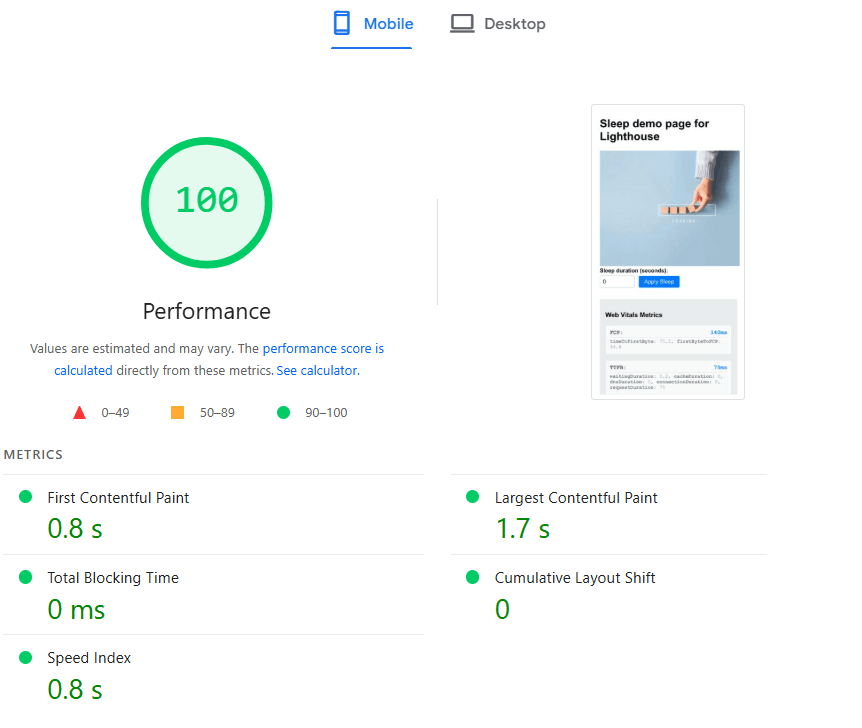 | With a 7s sleep i.e. TTFB delay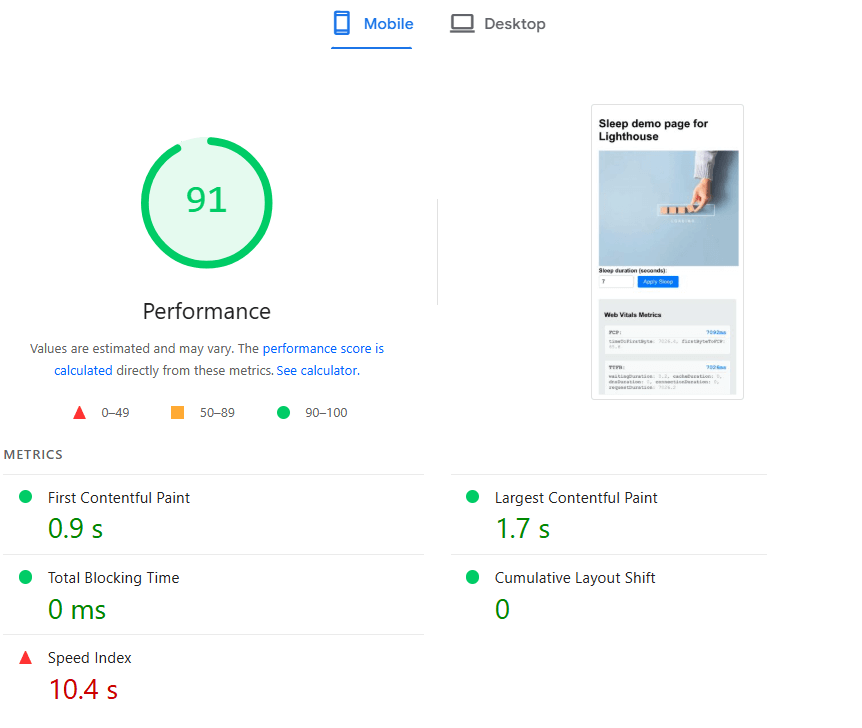 |
The test that made me rethink it all
I ran a simple test on a PHP page with just a heading, an image, some JS to dump Core Web Vitals information and an option to deliberately delay TTFB. Here's the demo page I used to simulate a slow and fast TTFB scenario:
So what did Lighthouse report when forcing a delay of 7 seconds via PHP's sleep function?
- 7025ms response time when looking at the diagnostics
- but then 0.9s as FCP
- and 1.7s as LCP
That's physically impossible. If nothing leaves the server until 7+ seconds in, how can anything visually render before that?
Why Lighthouse underreports TTFB
Let's start with my own assumption.
My Lighthouse assumption
In my early pagespeed days I've ran into this before.
I even wrote about this behavior 5 years ago on LinkedIn, thinking it was an intentional Lighthouse feature. Turns out it wasn't!
In short, it never really crossed my mind that this could have been a Lighthouse bug and I never cared to dive into the Lighthouse source code either. I just assumed Lighthouse was removing any TTFB because:
- Lighthouse is a frontend performance diagnostics tool;
- Which already comes with variability out of the box;
- As a matter of fact, when opening a Lighthouse issue on github, they specifically ask if you're sure that your issue is not about variability or throttling.
As a result, I filled in the gaps and concluded:
- this is surely done by design;
- to remove any TTFB fluctuations that could be impacting Lighthouse results even more;
- so that when running a (maybe scheduled) test during a newsletter or Black Friday, your Lighthouse test isn't being wrongly flagged.
I've always walked around believing this, until a Web Performance Developer Advocate from Google chimed in:
not sure what @Erwin Hofman's talking about to be honest?
That was a humbling moment!
What's really going on
Eventually, someone in this discussion found a similar issue on github where the matter is being discussed by Lighthouse maintainers from Google.
The short version: Lighthouse simulates performance, rather than just replaying it as a real browser would. It runs the page, collects a performance trace, and then models paint events under simulated conditions (like a mid-tier mobile device with slow network and CPU throttling).
This part really wasn't new to me.
But here's the bug: in some edge cases, Lighthouse starts the timeline before the server even responds, meaning FCP and LCP can show up before TTFB. Yes, seriously.
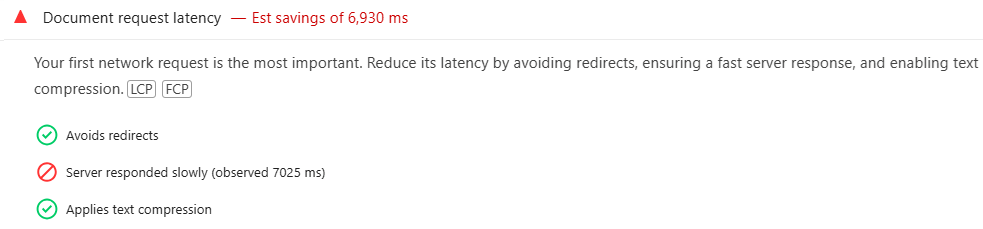
Lighthouse does mention the slow TTFB in the diagnostics, like this (see screenshot):
Document request latency
Server responded slowly (observed 7025 ms)
But the key metrics like FCP and LCP remain unaffected.
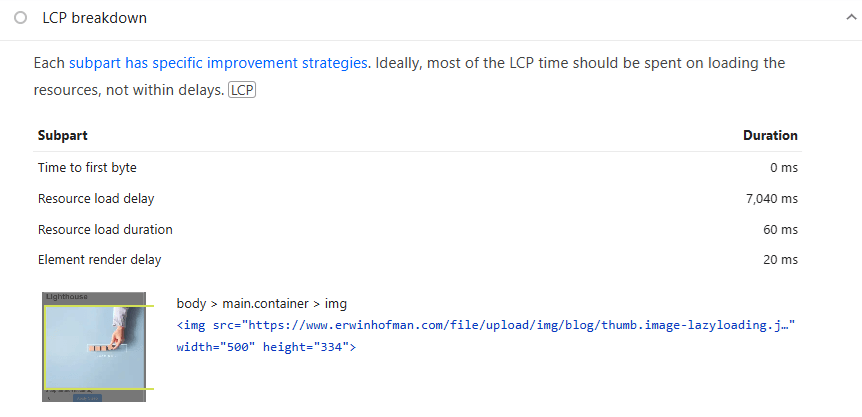
At the time of my LinkedIn post 5 years ago, Lighthouse wouldn't show LCP breakdown. But it does today and here's what the subpart breakdown shows (see screenshot):
Time to first byte: 0 ms
Resource load delay: 7040 ms
Resource load duration: 60 ms
Element render delay: 20 ms
So instead of counting the 7-second delay as TTFB, it is being attributed to Resource load delay i.e. how fast the image could be discovered by the browser after TTFB.
Isn't this fixed by now?
The Lighthouse team is aware of the issue and has talked about 'clamping' metrics so they can't occur before TTFB.
But the behaviour I spotted 5 years ago still exists in production tests and it turns out it's buggy behaviour instead of an intentional design decision. Clamping might exist in some parts of the code, but as I understand it doesn't consistently prevent these inaccurate metric results.
Implications of Lighthouse inconstancy
Aside from known variability when running Lighthouse, this adds another layer of unexpected outcome. As a matter of fact, I've seen people use Lighthouse test results to compare hosting providers based on results from TTFB. I already thought that was a bad idea 5 years ago, hence writing that LinkedIn post back then.
But this additional Lighthouse diagnostics and LCP breakdown is confirming that Lighthouse will detect slow TTFB, but not always reflect it in key metrics and will incorrectly attribute it in the LCP breakdown.
Lighthouse vs real user data (CrUX and RUM)
Although we now know poor TTFB will not be reflected by Lighthouse in PageSpeed Insights, a bad TTFB will directly contribute to bad FCP and LCP towards real users. Especially when structurally dealing with poor TTFB, your real user data will reflect this. For example:
- in Google's freely available CrUX data for your domain
- or private RUM data that you collected yourselves
In case you're new to CrUX and RUM versus Lighthouse, my RUMvision colleagues wrote about this before.
When using a dedicated tool like RUMvision for detailed TTFB data, you're even likely to see where bad TTFB is coming from, helping you to adequately address it.
Final thoughts (and lessons)
Lighthouse is still a great tool, but it has limits. Not scrolling nor interacting with your page, and stopping the test when the browser's main thread is idle for 5 seconds are a few examples. Unintentionally measuring TTFB incorrectly seems to be another one.
Admittedly, I've been using WebPageTest and DevTools for many years now for lab data testing. But despite the above, Lighthouse remains a good tool for cold pageload testing and even set the stage.
Just be sure to supplement your lab data with RUM data to get a complete and real user picture. And don't be afraid to admit when you're wrong and consult a specialist ;)
